General principle
SpeKtro is an interactive dashboard for exploring non-visual spectrum lighting for human health. It is based on two new unit-less quantities: the energy-related and the vision-related relative spectral effectiveness (RSE) factors.
The main goal is to help the investigator to develop a conceptual understanding of the various ways of evaluating spectral effectiveness of ocular light exposure using the RSE factor and gain sufficient knowledge to support its usage.
In addition to the default example, the investigator can import and analyze any light spectra of interest.
Related publications
This work has been presented at the CIE 2015 conference in Manchester UK [1] and submitted to the journal of Lighting Research and Technology (LR&T) [2]. The full-length journal paper describes the formulation of the RSE factor and the decisions behind the creation of the SpeKtro dashboard.
Overview

Energy-related RSE
The energy-related relative spectral effectiveness (RSE) factor enables the evaluation of a spectral power distribution (SPD) for a light source in terms of its comparative ‘energy’ relationship to an equal-energy spectrum for any system of photoreception. A low value (<1) of the RSE factor indicates that the light source has low stimulus potential for the photoreceptive system under consideration compared to the total irradiance. If the light source has high stimulus potential, the RSE factor will be larger than one (>1).

Vision-related RSE
The vision-related relative spectral effectiveness (RSE) factor enables the evaluation of a spectral power distribution (SPD) for a light source in terms of its comparative ‘brightness’ relationship to an equal-energy spectrum for any system of photoreception. A low value (<1) of the RSE factor indicates that the light source has low stimulus potential for the photoreceptive system under consideration compared to the total illuminance. If the light source has high stimulus potential, the RSE factor will be larger than one (>1).
Biological impact
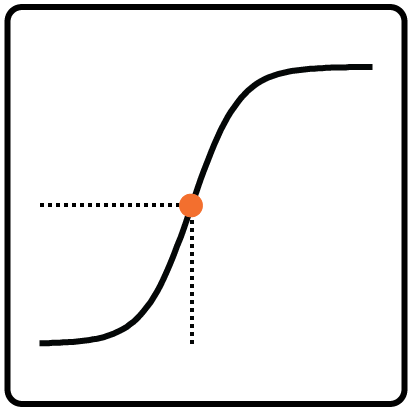
The equivalent light quantities are calculated from a known (experimentally measured) dose-response relationship. The dose-response curves displayed here are based on Zeitzer et al. [3] and Cajochen et al. [4], where the reference light source CIE F11 matches the experimental lighting conditions. These values are the equivalent quantities of light exhibiting a non-visual response that corresponds to a selected percentage of the desired effect achieved by a reference light source. This is a practical example of how to use the RSE factors to identify threshold values for experimental and real-world design scenarios.
Spectral power distribution comparisons
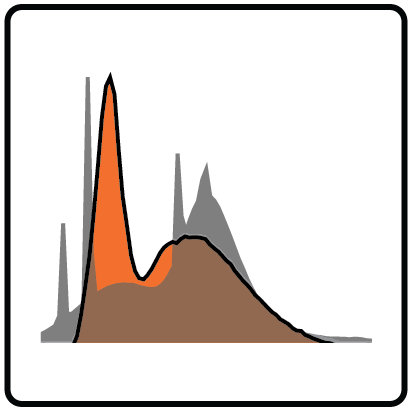
The relative spectral power distribution (SPD) of the selected light sources is displayed as a function of wavelength normalized to maximum power. The relative SPDs are shown for the visible part of the electromagnetic spectrum, between 390 nm and 700 nm. This range represents the sensitivity of the human eye to light energy. The import function allows you to import and analyze your own light sources.
Spectral weighting functions
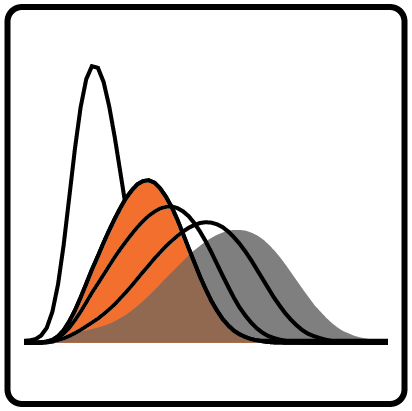
The spectral weighting functions show the relative spectral sensitivity of the five human photoreceptors and the photopic luminous efficiency. By default the RSE factor is computed for a 32-year-old observer. By alternating the age settings, the spectral functions will change according to a lens transmittance model [5]. All functions are scaled to have equal area under the curves.
References
- [1]
- M. L. Amundadottir, S. W. Lockley, and M. Andersen, “A unified framework for evaluating non-visual spectral effectiveness of ocular light exposure: key concepts,” in Proceedings of the 28th Session of the CIE, Manchester, UK, 2015, vol. CIE x216:2015. Full text
- [2]
- M. L. Amundadottir, S.W. Lockley, and M. Andersen, “Unified framework to evaluate non-visual spectral effectiveness of light for human health,” Unpublished manuscript, 2015.
- [3]
- J. M. Zeitzer, D.-J. Dijk, R. E. Kronauer, E. N. Brown, and C. A. Czeisler, “Sensitivity of the human circadian pacemaker to nocturnal light: melatonin phase resetting and suppression,” J. Physiol., vol. 526, no. 3, pp. 695–702, 2000. doi: 10.1111/j.1469-7793.2000.00695.x
- [4]
- C. Cajochen, J. M. Zeitzer, C. A. Czeisler, and D.-J. Dijk, “Dose-response relationship for light intensity and ocular and electroencephalographic correlates of human alertness,” Behav. Brain Res., vol. 115, no. 1, pp. 75–83, 2000. doi: 10.1016/s0166-4328(00)00236-9
- [5]
- J. van de Kraats and D. van Norren, “Optical density of the aging human ocular media in the visible and the UV,” J. Opt. Soc. Am. A, vol. 24, no. 7, p. 1842, 2007. doi: 10.1364/JOSAA.24.001842
Funding
This work was carried out with the support from École polytechnique fédérale de Lausanne (EPFL) and from the Swiss National Science Foundation (SNSF), project-153018.
Contact
This work was designed and developed by María L. Ámundadóttir as part of the LIPID research team under the supervision of Prof. Marilyne Andersen at EPFL, in collaboration with Dr. Steven W. Lockley a neuroscientist in the Division of Sleep and Circadian Disorders at Brigham and Women’s Hospital and an associate professor of medicine in the Division of Sleep Medicine, Harvard Medical School.
The dashboard was implemented by Thomas Denoréaz using PlayFramework and nvd3.js.
Please write to us for any suggestions, noticed issues, improvements, etc.
For more information about the LIPID team, please visit our website.